Managing a factory or logistics yard is one of the biggest challenges along the supply chain. Scarce space, many participants and unpredictable truck arrival times quickly lead to congestion and downtime. Only when you measure and optimise the right KPIs in yard management can you design processes efficiently and allocate resources in a targeted manner. In this article, you'll learn which metrics are important to you as a logistics decision-maker and how concrete actions can be derived from them.
Why yard management KPIs are important

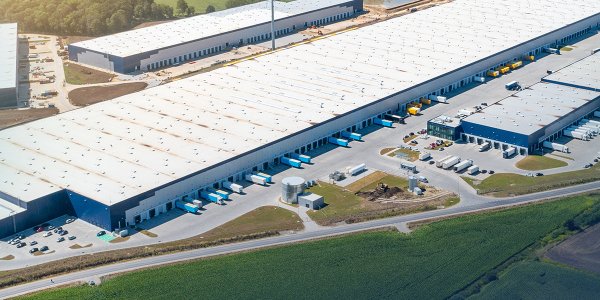
The yard is the bottleneck between road and warehouse. Even small delays affect the entire supply chain. Specific metrics make these processes visible and allow targeted improvement. A well organised yard keeps operations running smoothly, reduces delays and increases efficiency. Like other areas of logistics, yard processes can only be managed efficiently using appropriate KPIs.
The most important KPIs for plant and yard logistics
Truck turnaround times (trailer turnaround time)
Truck turnaround time measures the period between a vehicle entering and leaving. This value shows how smoothly the process runs from registration through loading or unloading to departure. Turnaround time is calculated by dividing the total time of all trucks or trailers by the number of processed ones.
Data collection: Log the entry and exit times for each truck or trailer. The average turnaround time serves as a baseline for target values.
Use: Long turnaround times indicate delays during loading/unloading, lack of resources or chaotic traffic guidance. Short turnaround times reduce demurrage and increase throughput capacity.
Optimisation: Better communication between yard dispatch, warehouse and truck drivers, optimised dock planning and the use of a yard management system (YMS) can significantly shorten turnaround time.
Punctuality status per carrier at the booked slot
For harmonised inbound logistics it's not only the time on site that matters but also the punctuality of arrival. This KPI looks at how often carriers meet their booked time slot. It can be defined as the proportion of on‑time arrivals per service provider.
Data collection: Compare the booked appointment with the actual arrival and departure times per carrier.
Use: The KPI identifies reliable partners and uncovers systematic delays. In case of deviations, discussions can help clarify causes and jointly develop solutions.
Optimisation: Automated advance notifications and bonus/malus models promote punctuality. YMS software often offers slot management with reminder functions.
Slot booking behaviour of partners
Not only adherence to slots is decisive but also how they are booked. The slot booking behaviour KPI records the time between booking and arrival as well as the frequency of short‑notice changes.
Data collection: Record timestamps of slot bookings and compare them with the planned appointment.
Use: Booking too late makes planning difficult and leads to peak times. Early booking makes resource allocation easier.
Optimisation: Encourage proactive booking behaviour through automated booking tools and define booking deadlines. Analysis reports for partners show how they use their slots compared with others.
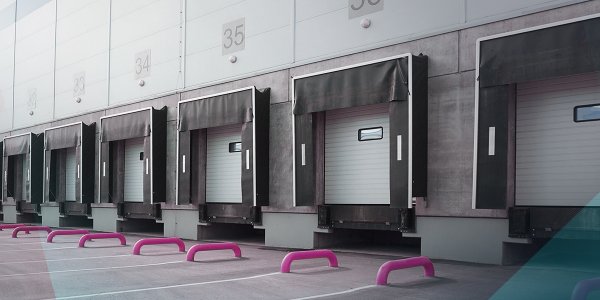
Utilisation of loading bays (Dock Utilisation Rate)
Utilisation of loading bays shows how efficiently the docks or ramps are used. The utilisation rate is determined by dividing the time docks are occupied by the total available hours.
Data collection: Record the occupancy times of all docks over a defined period and relate them to total availability.
Use: Low utilisation indicates idle times and inefficient planning. Over-utilisation leads to queues and stress for personnel.
Optimisation: Intelligent slot management, prioritisation by urgency and flexible staffing help balance utilisation. YMS software can automatically assign docks to the right loads.
Loading times per order
Loading time measures the duration of loading or unloading a single order. It influences both the turnaround time and the capacity of loading bays.
Data collection: Measure the time from docking the vehicle until completion of the loading process.
Use: Long loading times can indicate lack of personnel, inappropriate equipment or poor picking.
Optimisation: Training, standardised processes and the use of modern loading aids (e.g. automatic conveyor technology) shorten loading time. Clear task allocation reduces downtime.

No-shows and cancellations
No‑shows are vehicles that book a slot but do not show up. They block capacity and disrupt planning.
Data collection: Record planned slots and check whether they were actually used.
Use: A high no-show rate indicates unreliable partners or inflexible slot rules. It burdens utilisation and increases costs.
Optimisation: Set deadlines for cancellations and redistribute freed slots at short notice. Penalties or graduated priorities can reduce no-shows.
Truck call-off times
Truck call-off time describes the period between completion of the load in the warehouse and the call for the driver to proceed to the dock. Long call times unnecessarily extend vehicle dwell times.
Data collection: Log when a load is ready and when the driver is summoned to the dock.
Use: The KPI helps improve communication between warehouse and yard and avoid unnecessary waiting times.
Optimisation: Digital notifications, clear responsibilities and real-time visualisation of order status in the YMS shorten call time.
Strategic significance of these metrics
All the KPIs mentioned aim to make optimal use of resources, reduce costs and increase service quality. Truck turnaround times and loading times directly influence yard throughput, while punctuality status and slot booking behaviour increase planning reliability. Dock utilisation shows whether infrastructure and personnel are being used efficiently. No-shows and long call-off times represent hidden costs that are often underestimated.
By measuring and regularly evaluating these metrics you create an objective basis for decisions. This way you recognise trends and can react quickly to deviations – for example through additional shifts, process optimisation or adjusted supplier agreements.
Recommendations for decision-makers

1. Capture data digitally: Use a yard management system to automatically record entry and exit times, dock occupancy and loading times. Without a consistent data basis KPIs are not meaningful.
2. Define and communicate KPIs: Set target values for each metric and communicate them to all stakeholders. Transparent KPIs foster acceptance among employees and carriers.
3. Regular evaluations: Analyse the data at least weekly and discuss deviations within the team. If there are large differences between carriers a personal exchange is worthwhile.
4. Use automation: Modern YMS solutions support you in slot allocation, dock assignment and real-time information for deliveries. A YMS helps reduce turnaround time and plan docks efficiently.
5. Continuous improvement: Use KPIs not just for control but as a starting point for improvement initiatives. Small process changes – such as better signage or optimised routing – can significantly improve KPIs.
Conclusion: Why digital processes and modern yard management are essential
KPIs in yard management fulfil a strategic steering function. Without transparent metrics bottlenecks and inefficiencies remain hidden. Digital systems collect the necessary data automatically and enable comprehensive analysis. Solutions such as yard management systems offer functions for appointment scheduling, real-time tracking and reporting. A YMS helps shorten trailer turnaround times and make better use of dock resources.
For logistics decision-makers this means: Anyone who wants to make yard and plant logistics future-proof today cannot avoid digital processes and modern yard management. Only in this way can the KPIs mentioned be measured, evaluated and optimised efficiently – and only in this way does the yard become a competitive advantage rather than a bottleneck.